wtFact-February is coming! Get ready for my 20 best short Power BI tips!
It’s almost February and in the next days I will start a small series on LinkedIn.On every weekday, I will share a small tip for the main Power BI areas. The 20 best tips in a short version on LinkedIn Many times when I see issues with Power BI, the answers are going back to…
My experiences from my very first PASS data community summit 2022

A little more than 3 wees ago, I was at the PASS conference in Seattle. In this post I want to share my experiences from the 2022 PASS data community summit!
How to create a service principal for power bi
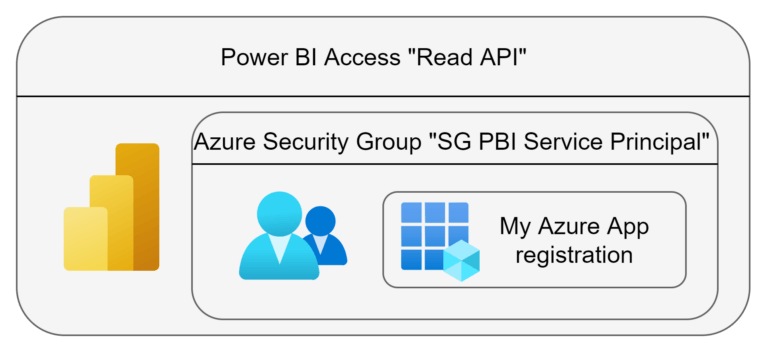
I will show you, how you can easily create an Azure service principal for Power BI!
Persisting temporary accessible data via Power BI Datamarts with the example of Power BI Activity Logs
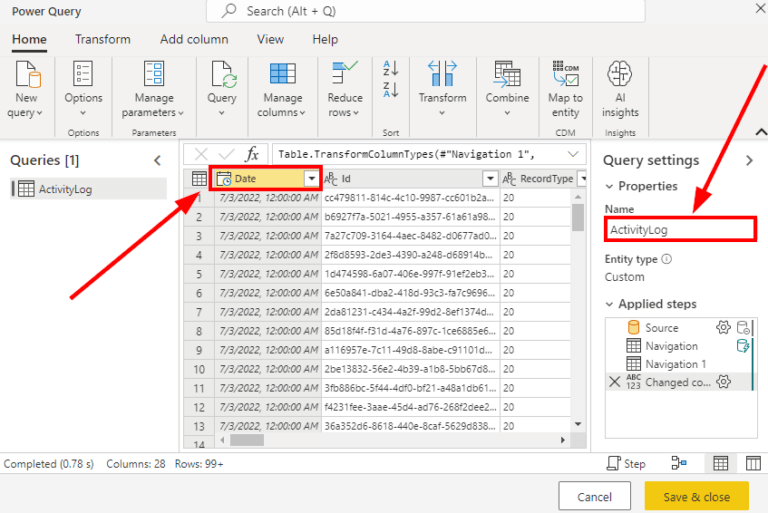
You can persist temporary accessible data like the Power BI Activity Logs only with Power BI Tools! With Power BI Datamarts and a data flow this is easily achievable!
Loading Web Data into Power BI Service without Using a Gateway
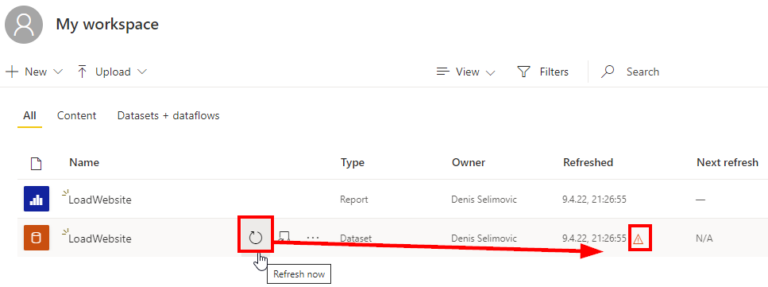
Many times, I’m creating a report in Power BI Desktop with data from a website. As an example, let’s imagine we create a report and load the population by country from this Wikipedia page. I’m loading data in Power Query from the web and at one point I am publishing my report to the Power…