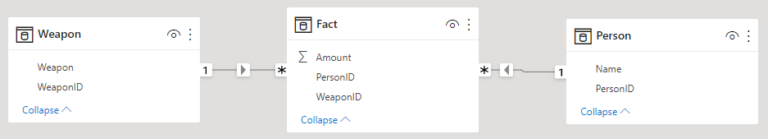
What are the strange symbols in a Power BI relationship? All you have to know about weak or limited relationships
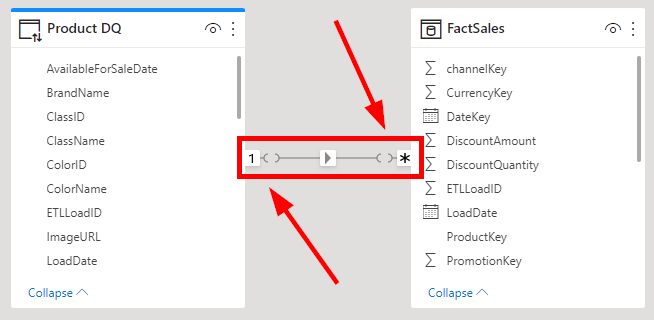
In a Power BI data model you sometimes find funny symbols in the relationship itself. This means that it’s a weak or limited relationship. In this article I will explain everything about weak relationships!
Change your slicer easily from OR to AND logic in Power BI
In Power BI, slicers generally have OR logic implemented. This I normally also exactly what the user wants to happen. If I select the years 2021 and 2022 in a slicer, then I would like to see the values in the result which are either related to the year 2021 or to the year 2022.…
Power BI Premium Gen2 is here – everything you need to know about it
It was already announced since the end of 2020 that there would be an update in Power BI Premium capacities. After being in preview for some time, “Generation 2” or “Gen2” short, as the new version is called, is now generally available. But what is the difference to the current Power BI Premium and what…
Use measure or virtual table as filter for CALCULATE
Last week, a colleague at work had an interesting question with a client. They wanted to perform a calculation with CALCULATE, but only wanted to include rows of the table where a measure has a certain value. Or in more simple terms, he wants to filter the table by a measure and then perform another…
Reporting for Everyone – Create accessible Power BI reports in just a few steps
An overlooked, but even more important topic in IT in general, but also in the area of business intelligence, is to make programs, or in our case reports, accessible to as many people as possible. What are the different types of barriers? Although there are other barriers, we will focus primarily on two areas. On…