Use measure or virtual table as filter for CALCULATE
This post is also available in:
![]() German
German
Last week, a colleague at work had an interesting question with a client. They wanted to perform a calculation with CALCULATE, but only wanted to include rows of the table where a measure has a certain value. Or in more simple terms, he wants to filter the table by a measure and then perform another calculation on the filtered table.
Measure always requires filter context
A characteristic of a measure is, that they always require a filter context. To make a simple example, my Measure has the formula Sales Amount = SUM( myTable, [Sales Amount]). This formula requires a filter context to execute against. Do I want to calculate the sales numbers per product or better the sales numbers by year? Or maybe by country or by customer? All these scenarios can be solved with the same formula that I just mentioned. But the difference on the result depends on the filter context.
Best product by category
For this scenario, I would like to use a simplified example. We assume I have different fruits and they are divided into color categories:
| Color | Product |
|---|---|
| Green | Kiwi |
| Green | Avocado |
| Orange | Orange |
| Orange | Mandarin |
| Orange | Peach |
| Red | Apple |
| Red | Cherry |
| Yellow | Banana |
| Yellow | Lemon |
I am interested in the sales of my fruits, so I will use Power BI to analyze them. More specifically, I’m interested in how the respective bestsellers of every product color perform. I can get the best seller per product color with a measure that returns the rank. Visually, this means I want to consider only the yellow highlighted rows for 2020:

The logic should work depending on the filter context. When I analyze the values for 2021, the ranking may change, as it is the case for Green and Orange:

Based on the top products for each color categories, I would now like to create a measure. For example, the average sales of these top products.
Creation of a virtual table with relevant measure
How is it now possible that we always filter on the rows with rank 1 in a measure? A measure like our ranking measure always needs a filter context. The answer is relatively simple, we need to manually build our filter context within the Measure using virtual tables.
To better understand the intermediate steps of the development, we will develop the measure in the DAX Studio. To do this, we first take a look at the Products table using the EVALUATE function.

To this table we would like to add our ranking in the next step. We can do this with the ADDCOLUMNS function:

We can save this virtual table in a variable, so that the code is easier to read. With the DEFINE VAR command we can create a variable called vRankTable. To this variable we assign the virtual table. We return the table at the end with the EVALUATE command. This one still looks identical:

Now we want to filter the table down to the products that have rank 1 in their color category. For this we use the FILTER function and filter on rank 1. As table to be filtered we take our virtual table just stored in the variable:

We can also save this filtered table in a variable for a better overview:

Using the filtered table as a basis for CALCULATE
In our case, we have now filtered the product table to the top products in the current filter context. Now the question is how to integrate this into CALCULATE. After all CALCULATE does not need a table as a parameter, it just needs some filter criteria, right? The answer is simple and possibly surprising, but tables arefilters in Power BI!
This sounds counterintuitive at first, since you often use functions like FILTER or REMOVEFILTERS to modify the filter context. But basically, most functions simply return tables that override the filter context of the current measure. I recommend that you take a look at the topic of Expanded Tables. This helps enormously in the understanding of DAX.
However, Expanded Tables would be a topic for a whole series of articles, so I won’t go into the basics now, but instead simply how to use tables as filters.
In our example, this means that we can simply use the virtual table as a filter for CALCULATE. Since CALCULATE returns a single value, but we need to return a table in DAX Studio. We can return the CALCULATE with curly braces as a table in fast notation:

As an example, our top products achieve an average sale of 2,833.33 USD. If we compare this to the general average of all products, the general is slightly below:

Integration in new measure
In the end, we still have to convert the code we just developed into a Power BI measure. For this purpose, the DEFINE can be replaced by the measure name and the EVALUATE can be replaced by a RETURN. We don’t need the curly braces anymore, because the measure now has to return a single value and not a table like in DAX Studio:
Average Top Products =
VAR vRankTable =
    ADDCOLUMNS (
        Products,
        "@Rank", [Rank Color]
    )
VAR vFilteredTable =
    FILTER (
        vRankTable,
        [@Rank] = 1
    )
RETURN
    CALCULATE (
        AVERAGE ( Sales[Amount] ) ,
        vFilteredTable
    )
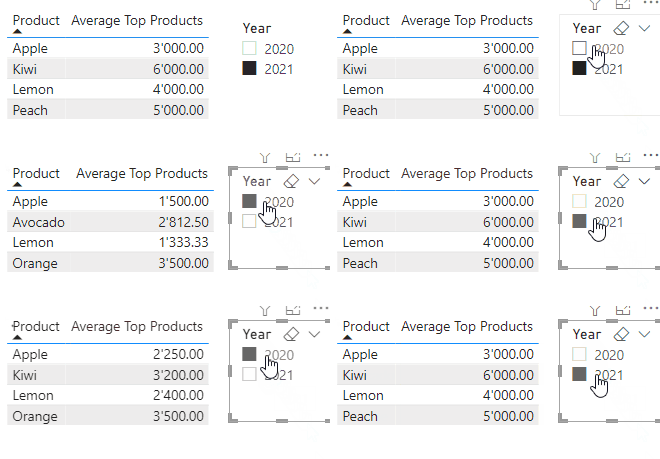
As a result, we can use all kinds of functions in our CALCULATE. In our case, for example, an average of sales of the top product in each color category. And the measure completely dynamically takes into account any filter context:

Download sample file
