Dynamic scaling of a measure in Power BI with DAX
This post is also available in:
![]() German
German
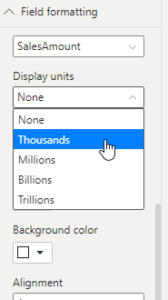
Automatic scaling of metrics or measures is possible in Power BI for just about any visual. However, there is currently no possibility to dynamically adjust tables or the matrix.

With this selection the values can be displayed in millions, for example.

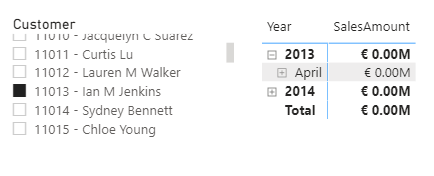
Even if the values are restricted due to a slicer, filter or drill down, the manually set scaling is kept. Depending on the constellation, this leads to the strange situation that no more information can be obtained from the report because the values are too low for scaling.

While this is handled in a graphical visual and the scaling is adjusted, this option is unfortunately not available in a table or matrix.
Dynamic scaling with DAX
However, you can influence the formatting directly in a DAX measure so that it automatically adapts to the displayed value. The FORMATfunction will help us here. This function is similar to the formatting in Excel and only allows us to adjust the visualization, the values remain unchanged.
The following syntax would display the value as a normal number:
FORMAT( SUM( FactInternetSales[SalesAmount] ) , "€ 0.00" )The documentation for custom formats shows us that a comma helps to “shrink” the displayed number in blocks of thousands. In a nutshell, each comma shows 3 digits less.
So the representation in thousands would be for our measure:
FORMAT( SUM( FactInternetSales[SalesAmount] ) , "€##0,.00 Tsd" )To get the representation in millions an additional comma is sufficient:
FORMAT( SUM( FactInternetSales[SalesAmount] ) , "€##0,,.00 Mil" )Which scaling should be displayed we have to define in the measure. Here we calculate whether the given number can be divided by 1,000, 1,000,000 or 1,000,000,000 and then return the value in the appropriate formatting.
This can be done by nested IF functions, but I personally prefer a SWITCH(TRUE() for clarity reasons.
SUM Sales dynamic =
VAR _SumSales =
    SUM( FactInternetSales[SalesAmount] )
VAR _FormattedDate =
    SWITCH(
        TRUE(),
        _SumSales / 1000000000 >= 1, FORMAT( _SumSales, "€ ##0,,,.00 Mrd" ),
        _SumSales / 1000000 >= 1, FORMAT( _SumSales, "€ ##0,,.00 Mil" ),
        _SumSales / 1000 >= 1, FORMAT( _SumSales, "€ ##0,.00 Tsd" ),
        IF( ISBLANK( _SumSales ), BLANK(), FORMAT( _SumSales, "€ 0.00" ) )
    )
RETURN
    _FormattedDate
When we now display this measure in our table, the scaling is automatically adjusted. No matter if we have the overall view:

And also when we filter on individual customers:

However, the approach still has 2 disadvantages:
- Since the FORMAT function returns the value as text, the measure can unfortunately not be displayed in graphics.
- As already mentioned, since it is text, the decimal places can unfortunately not be adjusted dynamically.
