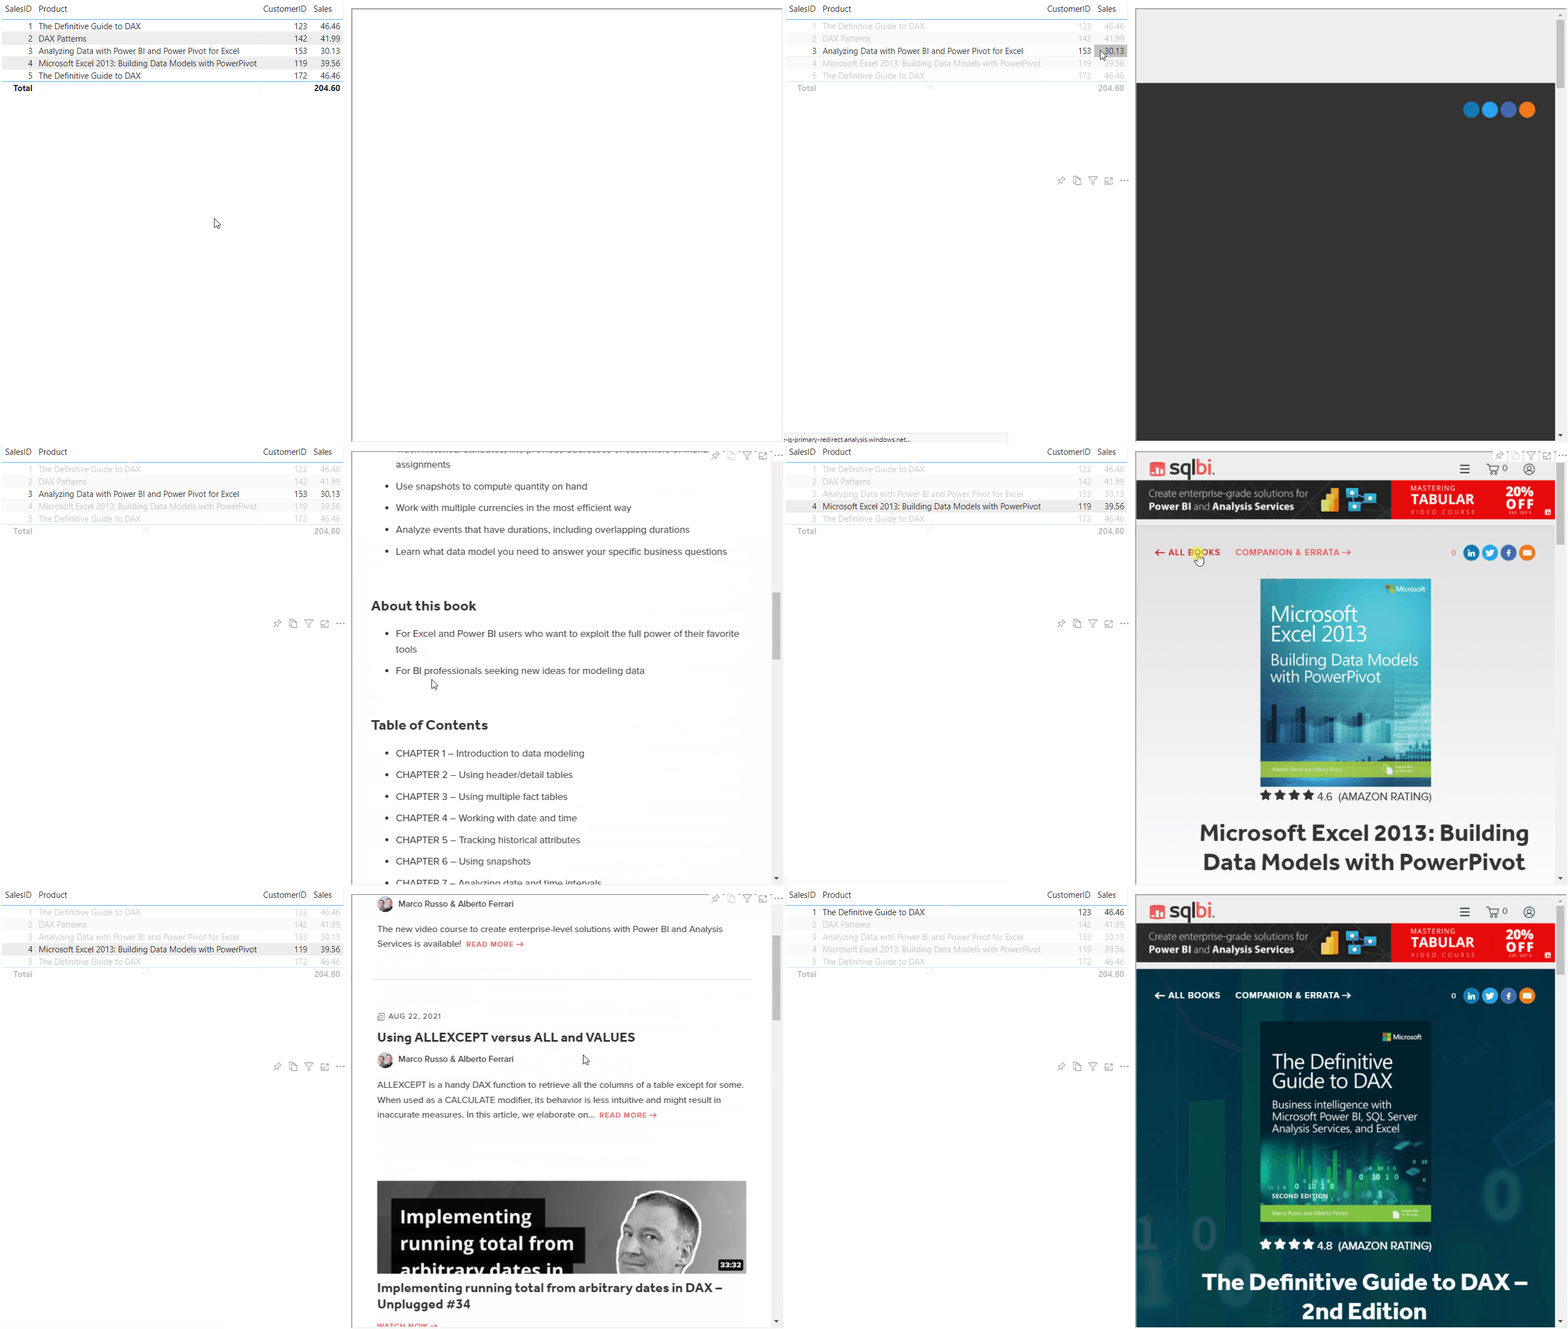
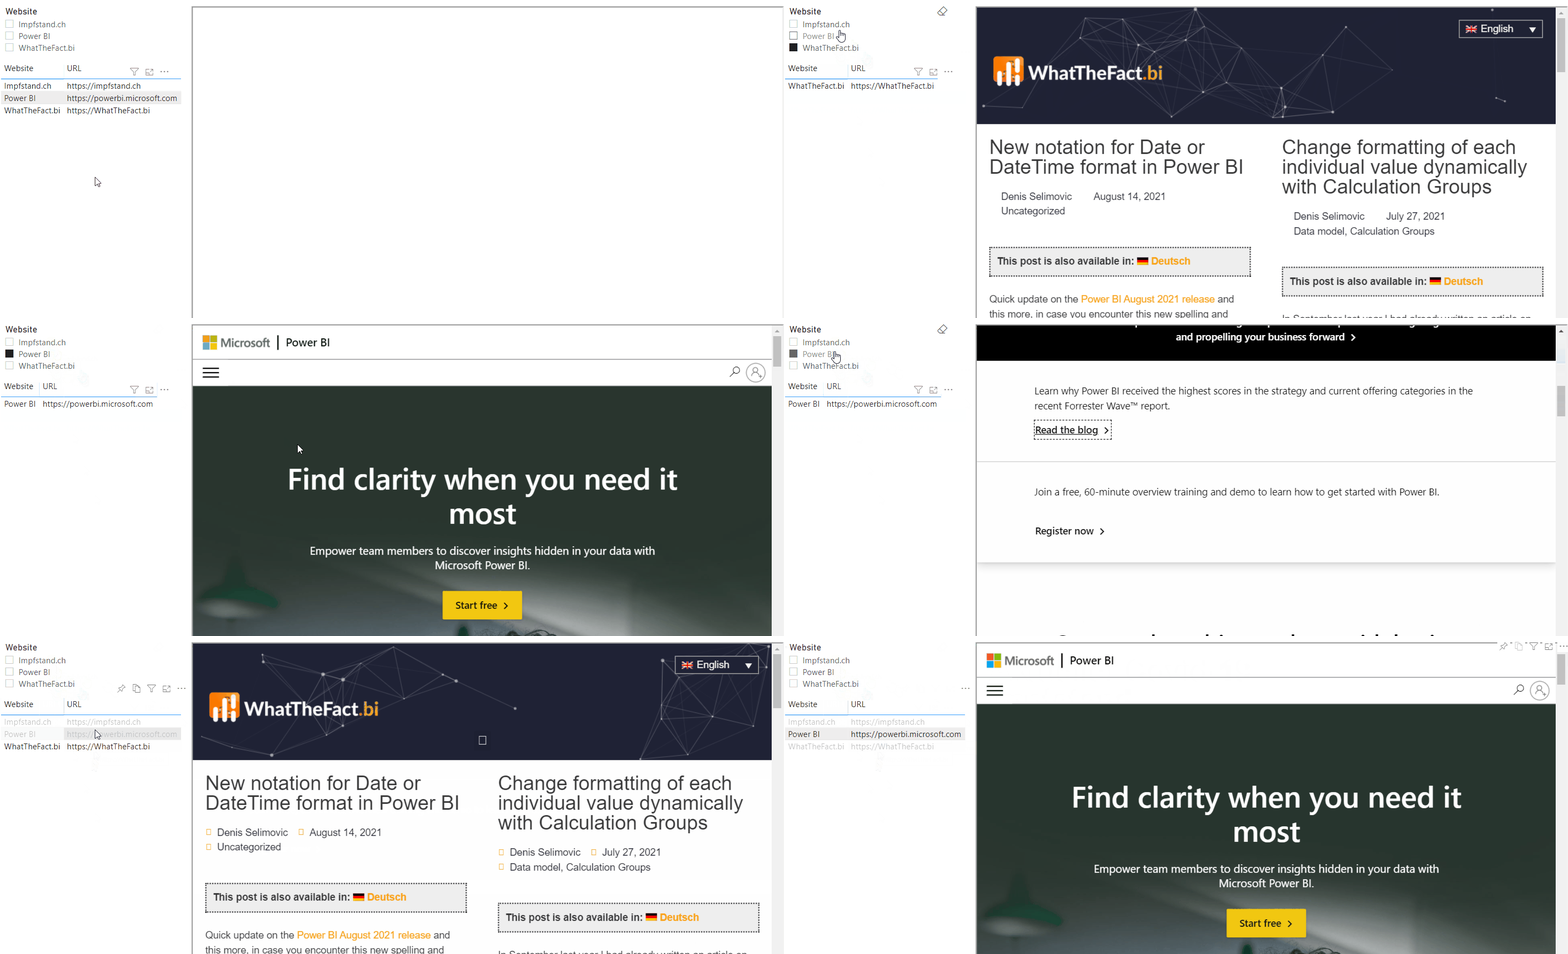
Recently, I had received several questions about whether you can view a website directly in Power BI. This can be implemented quite easily and is a good way to add more information to a report.
However, one restriction must be mentioned in advance. Unfortunately, Power BI Desktop does not load web pages, so we will focus on the Power BI Service here. But as a final result, here’s what we can look forward to:

Loading via iFrame with HTML5 Visual
In order to be able to load a website into our report, we must first ask ourselves which visual this can be done with. Here the HTML5 Viewer visual is very useful, with which we can display HTML code in a visual. In HTML itself there is then the iFrame tag, which allows to embed another website into your own website – or in our case into our Power BI Visual. This combination allows us to embed a website directly into a Power BI report.
But the website author can prevent the website from being included via iFrame. For example, YouTube and Google prevent embedding via iFrame. In this case, simply no content is displayed.
Add URL to table and create measure
First of all, of course, the URL must exist in the desired table and this must be returned by a Measure. In a first example, we create a simple table with the website name and the corresponding URL:

Now we have to create a measure that returns the selected website:
SelectedURL = SELECTEDVALUE( Websites[URL] )What we need then is the code of the iFrame itself. In general, it would work to use only the iFrame tag. But personally I prefer to use correct HTML, which is why I use the basic tags of a website. My measure then looks like this:
IFrame =
"<!DOCTYPE html>
<html>
<body>

<iframe src='"& [SelectedURL] &"' style='position: fixed; width:100%; height:100%'></iframe>

</body>
</html>"
In the iFrame itself, we use as the website URL (src) the measure that returns the selected website. The style tags are required for the website to take up the full size of our visual. Otherwise the website would only be rendered in a small square.
What is missing now is the visualization. In order to do this, we first need the custom visual “HTML Content” (https://www.html-content.com), which allows us to render HTML content as a visual:

After that we still drag the measure “iFrame” into the HTML visual and create a slicer or table with which we select the desired website:

The PBIX file can be downloaded here:
