Change formatting of each individual value dynamically with Calculation Groups
This post is also available in:
![]() German
German
In September last year I had already written an article on how to dynamically adjust the values of a measure, for example in millions, thousands or without scaling:
Dynamic scaling of a measure in Power BI with DAX
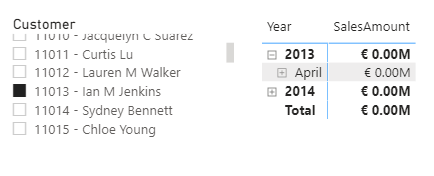
The approach at that time with the FORMAT function had a big disadvantage, the value is always converted to a text with FORMAT. This means that the measure can only be used in tables, because bar and line graphics cannot display texts.
With old approach representation only possible in tables
In the meantime, however, there is a much better way to display a measure with dynamic formatting using Calculation Groups. With Calculation Groups I can also create the formatting dynamically via DAX and this is – like every DAX function – calculated individually for each row.
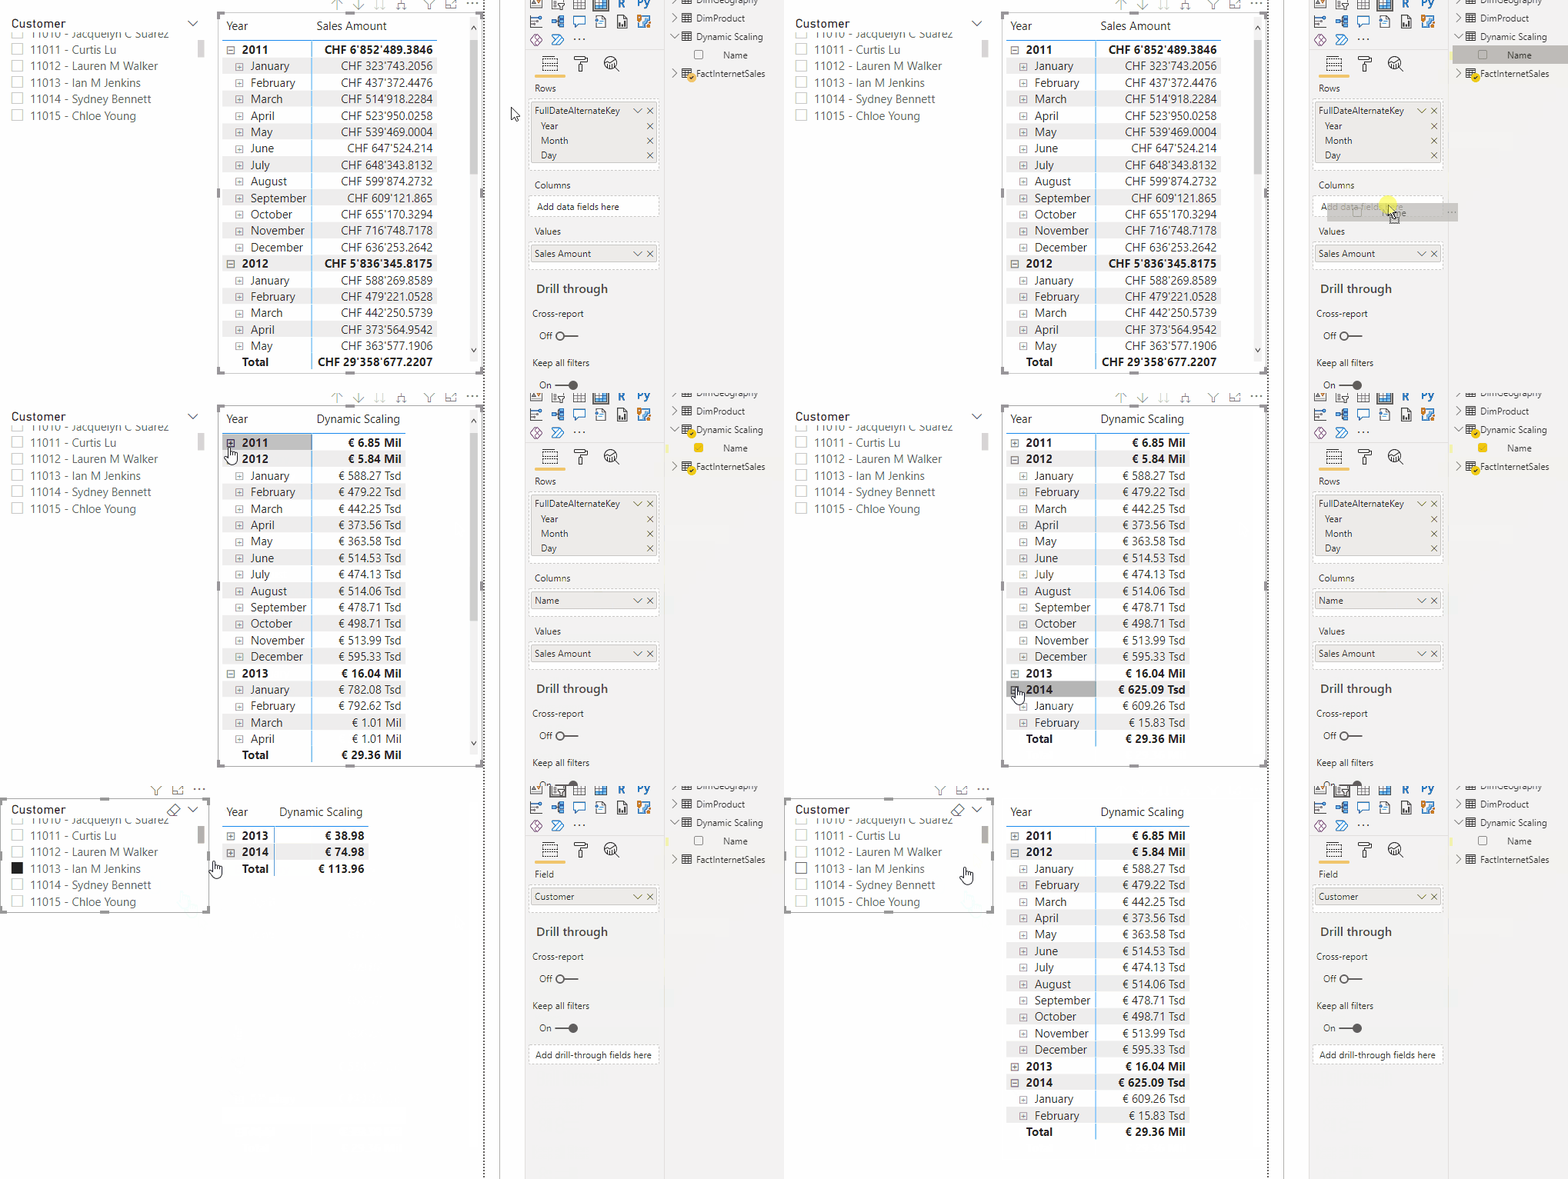
I use the same scenario as in the original article. If I have not selected any customers, I get high numbers and therefore I want to get scaling:

However, if I filter on a specific customer, then the values should be displayed without scaling, because the scaling is too high in the normal case:

Implement formatting via Calculation Groups
In this approach we need Calculation Groups, means from Power BI we start our Tablular Editor via External Tools:

Then we create a new Calculation Group with a right click on Tables and give it the name “Dynamic Scaling”.

Then we create a new Calculation Item by right-clicking in the current Calculation Group and give it a name of our choice:

In the Expression Editor, we now simply enter the SELECTEDMEASURE() function, since we just want to return the value:

Dynamic formatting via DAX in the Calculation Groups
So far, this has not been particularly spectacular. But now it gets exciting, because we can not only change the value itself via DAX, but also the formatting. To do this, we change the Expression property in the Expression Editor to “Format String Expression”.

In the empty field we can now insert a DAX formula that returns the format string that will be used for the respective field. In our case, this is more or less the measure from the original article, but we only return the string itself:

The exact code is:
VAR vMeasure = SELECTEDMEASURE ()
VAR vFormat =
    SWITCH (
        TRUE (),
        vMeasure / 1000000000 >= 1, "€ ##0,,,.00 Mrd",
        vMeasure / 1000000 >= 1, "€ ##0,,.00 Mil",
        vMeasure / 1000 >= 1, "€ ##0,.00 Tsd",
        "€ 0.00"
    )
RETURN
    vFormat
After that, we save the changes we made in the Tabular Editor and switch back to Power BI. Here we get the message that the Calculation Group needs to be refreshed, which we confirm by clicking on “Refresh now”:

After that, we just need to add the Calculation Group wherever we want the dynamic scaling. The formatting adjusts automatically from then on:

Conclusion
The advantage of this approach is that we only change the formatting, but not the value itself. This means we can still use the measure for all visuals like bar charts and the like. Another advantage is that the Calculation Group works for all Measures. So I don’t have to implement this approach again for each measure, I can use this kind of formatting for each measure on the whole data model from now on.
