What are the strange symbols in a Power BI relationship? All you have to know about weak or limited relationships
This post is also available in:
![]() German
German
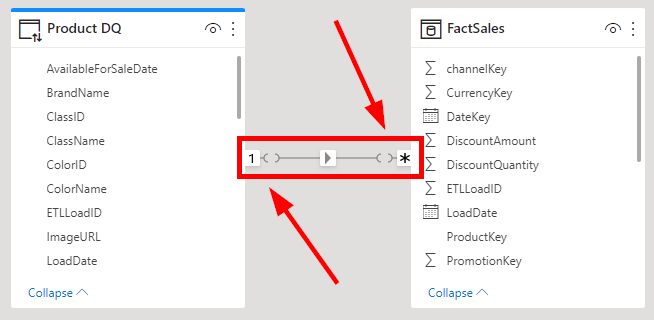
Sometimes when you look at a Power BI data model, you see the following strange symbol in the relationship diagram:

If you are wondering what that is and why the symbol changes like this, then this article will hopefully help you to understand weak relationships.
What is a weak or limited relationships in Power BI?
In general, the icon tells you that this relationship is a weak relationship. Nowadays, the term “weak relationship” was replaced by “limited relationship”, but you can consider these names as synonyms.
A limited relationship happens, when Power BI cannot guarantee the cardinality on the “one” side in a relationship. This can happen for two reasons:
- A many-to-many relationship is being used
- The tables are used from different sources in a composite model
When we look at the following example of a data model, we see both examples:

First we see the weak relationship because the table “Product DQ” is accessed via direct query. On the right side you see the regular relationship to the table “Product”, that is imported. As two tables are imported and one table is accessed with direct query, this is considered a composite model. Power BI cannot guarantee the granularity in the direct query table, as the values could change at any second and Power BI has no possibility to ensure the proper granularity.
How does a limited relationship affect my data model?
Now that we know that we have limited relationships, we should know what is the impact of that. In general, the way, a query is executed is changed in a pretty strong way and also expanded tables don’t work with a weak relationship. Alberto Ferrari wrote an in depth article on that. But as a user, you most likely don’t have to really deal with that.
The biggest difference in the most cases is the handling of blank rows in the one-side of the table.
Blank rows won’t appear on the one-side in weak relationships
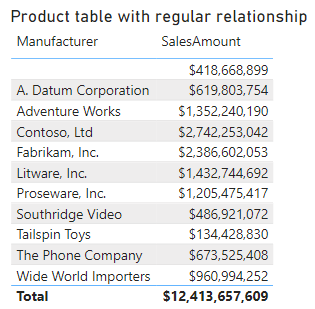
Let’s take the following table as an example. We imagine we have in the Sales table products with a brand, that doesn’t exist in the dimensional table. In a normal one-to-many-relationship between the tables, an extra row will be created with an empty brand and the correct values:

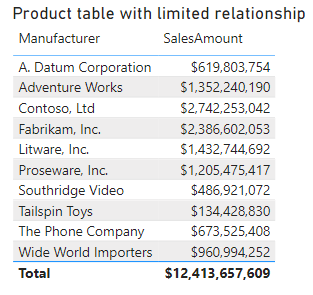
In a limited relationship, this mechanism won’t work anymore. So if we take the same table from a composite model, the result changes. The values without a brand, won’t appear anymore on the one-side. But they appear in the total:

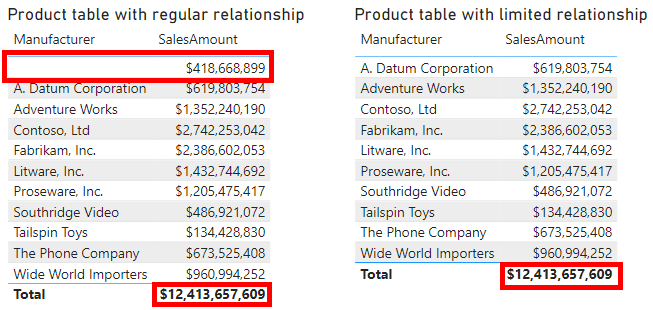
If you see both tables next to each other, the difference becomes clear:

This can be quite dangerous, as we don’t see that there are items in the sales table without an element in the dimensional table!
