Easy week over week comparison in Power BI with the new OFFSET function
This post is also available in:
![]() German
German
In data analysis a common requirement is to compare your values of one week to the ones of the previous week. Such a week over week comparison gives important insights as you compare a bigger timeframe and can – without waiting for months – still see where the trend is going.
How to handle the change of the year
Usually you can just take the measure in a specific timeframe like the current week, for example week 28 of the current year 2023, and compare it to the previous week, in this case week 27 of 2023. However, such a comparison becomes challenging, as you have to handle the change of years. Somehow you have to manage that week 1 in 2023 suddenly compares to week 52 in 2022.
And this is also the biggest challenge in week over week comparisons. You just cannot compare to the last week as if it would be a continuous number.
New approach with window function OFFSET
In the past there were a few approaches on how you can solve this issue, but all of them were kind of complex. However with the introduction of the new window functions, we can use now an approach that is a lot simpler.
As mentioned already, we are going to use the new OFFSET function. The OFFSET function returns a row relative to the current one. And that is exactly what we need here. We want to have the value from the last row (= previous week) compared to the current one.
As a general example for the OFFSET function, I use a simple table and display the brands and the sales amount. If now I use the OFFSET function in a new measure, I can get the value relative from the current position. In the following example I defined that I want the previous item (-1) by brand. So the table looks like this and I always get the data from the last row in the measure OFFSET Brand:

The syntax is very simple as we just use CALCULATE to change the filter context and use OFFSET as modifier. We define how big the offset should be and by what the offset should happen. So the measure OFFSET Brand looks like this:
OFFSET Brand =
CALCULATE(
    [Sales Amount],
    OFFSET(
        -1,
        ORDERBY( 'Product'[Brand], ASC )
    )
)
Be aware that at the time of writing this article, the syntax highlighter in Power BI doesn’t fully support the new window functions. So although the measure is correct, there might be some red lines in the editor:

Hopefully by the time of reading this article, the syntax highlighter is fully supporting the window functions.
Create a column for the full week
In order to implement the new approach, we simply have to have a column in our data model with the week and year for each day. This column we will use for the sort for the offset to get the previous week.
Be aware that we want to compare whole weeks. For that reason we have to add a column that is using the ISO 8601 standard that is common Europe. The normal US- and Australian standard won’t work as it can have half weeks by the change of the year. Take a look at the article “Calculate ISO 8601 week in DAX” where I describe the whole szenario.
Here the quick explanation.
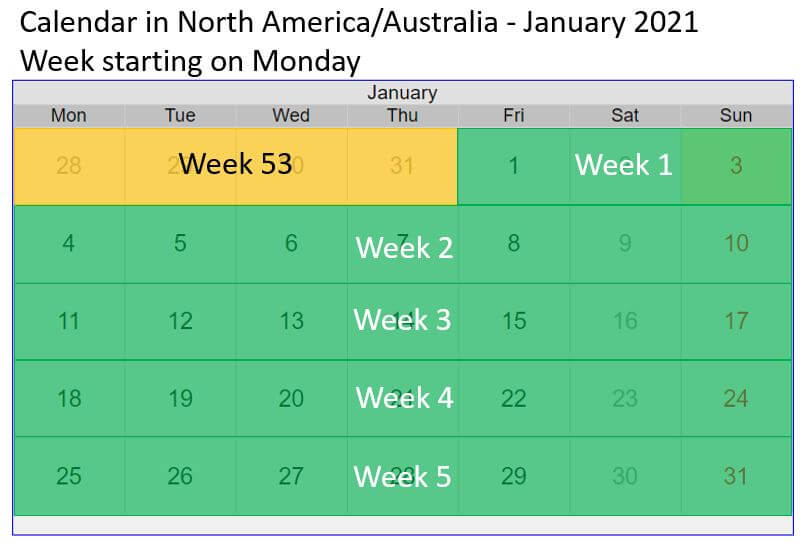
In the US-calendar the week of January 1st is always week 1 of the new year. This we cannot use as we would compare week 2 with 7 days, to week 1 with only 3 days in 2021. Also week 53 in 2020 would only have 4 days. So this calendar isn’t useful as it’s not comparing whole weeks:

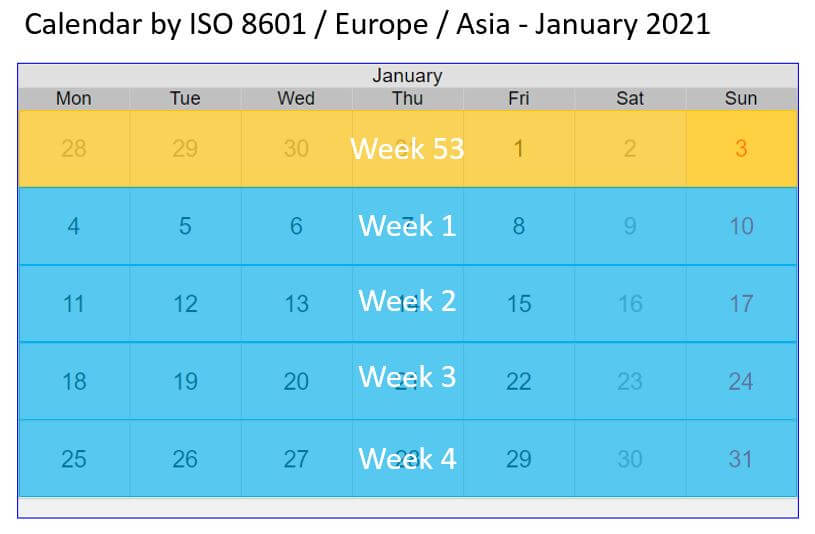
The ISO 8601 calendar is dealing with whole weeks. Accordingly we can use that as we always have full weeks to compare:

For that reason we are going to create a new column as combination of the year and the week number. We can easily do that in DAX with the following calculated column:
Year Week =
VAR _YearCurrentRow = YEAR ( 'Date'[Date] )
VAR _MonthCurrentRow = MONTH( 'Date'[Date] )
VAR _WeekCurrentRow = WEEKNUM ( 'Date'[Date], 21 )
VAR _YearReturn = IF( _WeekCurrentRow > 50 && _MonthCurrentRow = 1, _YearCurrentRow -1, _YearCurrentRow )
RETURN
    _YearReturn * 100 +_WeekCurrentRow
Be aware of row 5 with the variable _YearReturn. We have to make sure that the first days of the new year still get the year and week of the old year. Like in the last picture, in 2021 January 1st to 3rd are by ISO norm still in week 53 of 2020.
Like this, our year and week column will look like this:

Use OFFSET function to get the previous weeks values
Once we created this column, the rest is pretty easy. We can now use CALCULATE to change the filter context and use OFFSET to get the previous week:
Sales Previous Week =
CALCULATE(
    [Sales Amount],
    OFFSET(
        -1,
        ORDERBY( 'Date'[Year Week], ASC )
    )
)
From then on we get the values from the previous week with the new measure:

This also means from then on it’s pretty easy to do all kind of measures that consider a week over week comparison. For example we can now easily calculate the week over week change in percent:
Week over Week in % =
DIVIDE( ([Sales Amount] - [Sales Previous Week] ) , [Sales Previous Week] )
Like this we get the change from week to week in percent:

Summary week over week with OFFSET
We know that there is a challenge with the week over week comparison as we somehow have to handle the change of the years. With a proper week column in the ISO format we can easily create an order for all of the weeks and over multiple years.
Afterwards we can use the new OFFSET function to always get the last element as the last week value. This includes the change of year, as we always get the correct previous element with this approach.

