Why is it sometimes not possible to select the exact number in the what-if parameter and how can this be solved?
This post is also available in:
![]() German
German
I like working pretty much with the what-if parameter in Power BI. With the help of this, it is possible to run through corresponding scenarios in a very fine-grained manner. What would my operating result look like if I can increase my sales by a factor of 2? How would it look with 1.5? And how about 2.35? I am aware that these increases are extremes. But with the what-if parameter, such evaluations go very easily with a single slider.
Problem the what-if parameter does not work, the exact number cannot be set
However, there is occasionally the case that exact values cannot be set. Let’s take the case just mentioned as an example. I would like to evaluate the development of my sales, accurate to 0.01 points. Accordingly, I create a what-if parameter:

As range I would like to be able to select from -20 to 20 and the individual values should increase by 0.01 points:

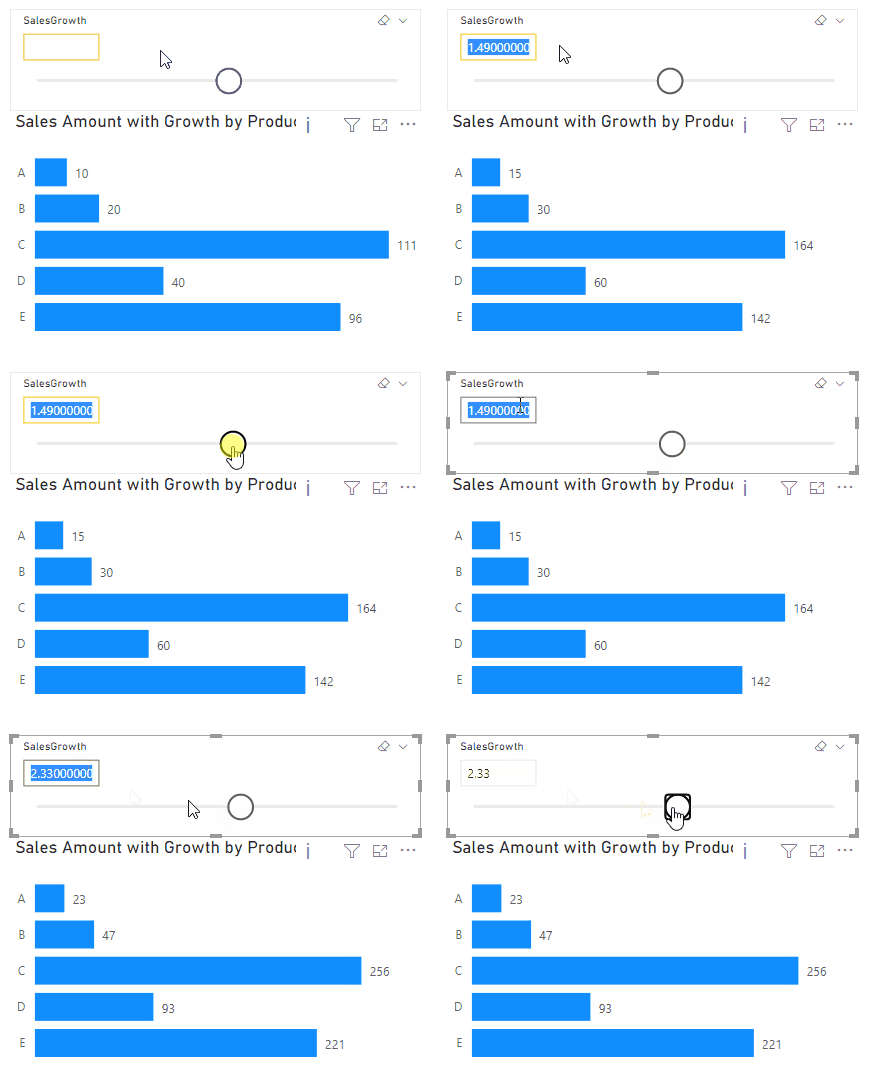
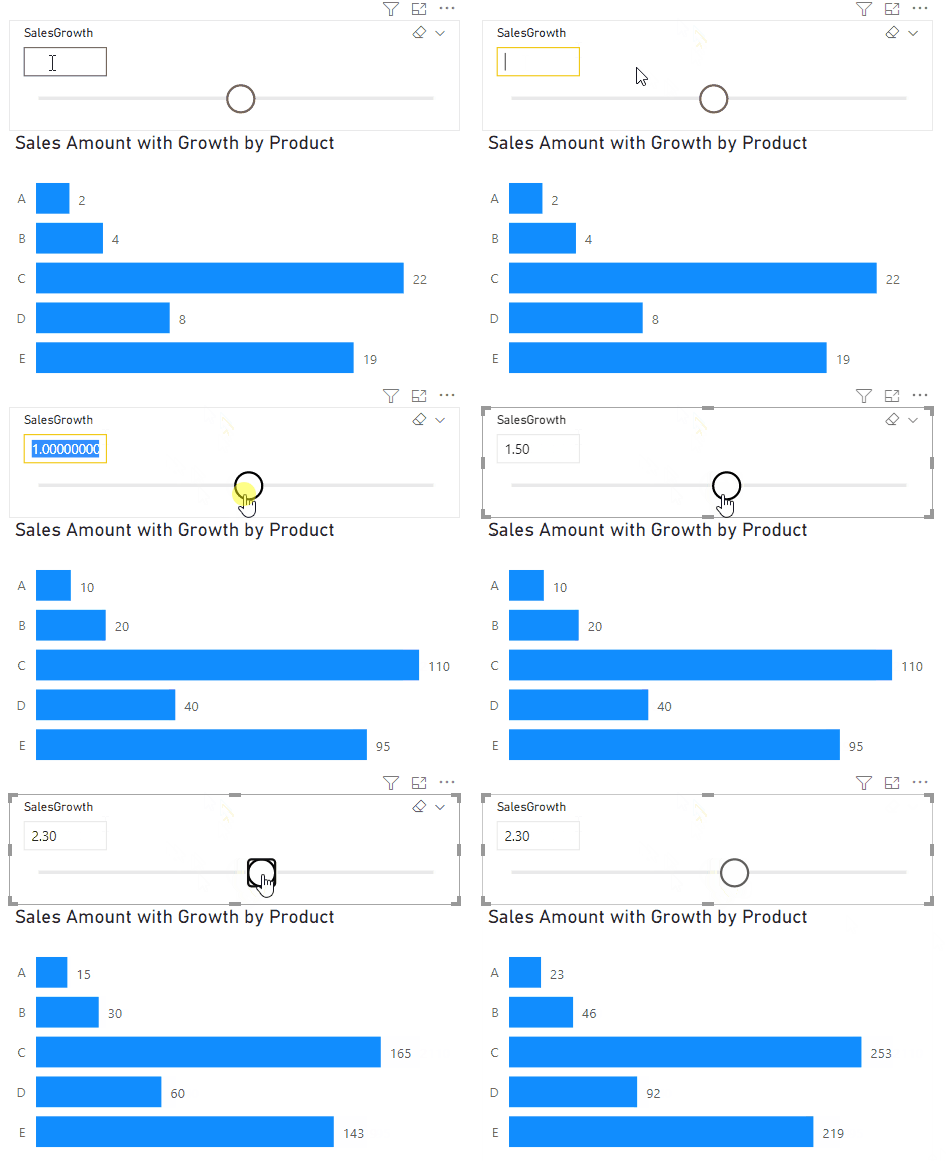
Now when I try to adjust the slicer of the what-if parameter to 1, 1.5 or 2.35 something strange happens, I don’t get the slicer set exactly to the value I want:

Reason: Limitation to 1002 values per slicer
What is the reason that I cannot select exact values? Let’s first look at the generated table to see if the values are available at all. The parameter creates a table with the GENERATESERIES function. With a granularity of 0.01, we would need 100 values for a whole number. Since we cover the range from -20 to 20, this would be 40 x 100 = 4,000 individual values. This also is provided by the table:

Therefore, it is not the table that is to be blamed. Let’s take a look at the generated DAX code with the Performance Analyzer:

The DAX code of the slicer looks like this:
// DAX Query
DEFINE
  VAR __DS0Core =
    VALUES('SalesGrowth'[SalesGrowth])

  VAR __DS0BodyLimited =
    SAMPLE(1002, __DS0Core, 'SalesGrowth'[SalesGrowth], 1)

EVALUATE
  __DS0BodyLimited

ORDER BY
  'SalesGrowth'[SalesGrowth]
When we execute the query, we immediately notice the problem. The entire series is no longer displayed. There are gaps here compared to the original table:

If we take a look at the DAX Query, we can immediately see why this is happening. The following line is to be blamed:
VAR __DS0BodyLimited = SAMPLE(1002, __DS0Core, 'SalesGrowth'[SalesGrowth], 1)The slicer limits the number of values to 1002 individual values! These are selected with the SAMPLE function in the selected range evenly distributed.
Ways to work around that
If you want to work around that, there are a few approaches.
1. restrict table to 1,002 values
The first option is to limit the data set to 1,002 values. In our case, this would be possible by restricting the granularity to one decimal position:

This way you will get only 400 values instead of 4,000 and the slicer can display all of the corresponding values. However, you have to restrict the granularity a bit to stay within the 1002 line limit:

2. modification of the slicer
Another option would be to adjust the slicer. For example, as a list or dropdown, the slicer will display the entire list of all values:

Also, the slicer can be adjusted to a “Less than or equal to” or “Greather than or equal to” slicer:

The entire range between the start and end values is then automatically displayed. Consequently, the individual steps that we would actually have liked to see are lost under certain circumstances.
For example, if I wanted to increase the slicer in increments of 5, this variant would provide all numbers between the start and end values and not in increments of five. In addition, the formula of the measure to be evaluated must be adjusted to MAX or MIN of the respective slicer, instead of SELECTEDVALUE as we had it before. Also, the start and end area are always displayed here in the slicer itself, which is probably undesirable according to the scenario.
Conclusion
The what-if parameter is still, from my point of view, one of the best ways to represent changes in a scenario. However, one must be aware of the limitations in the number of values on 1002 lines if one wants to select specific values. From my point of view, a note in Power BI would be a good solution here.
